I've started my chRistmas countdown
An R advent calendar
I had this grand idea last year of making an R advent calendar, although I was a bit too late to make one on time for the Christmas 2018 countdown.
This year the idea came back to me a few weeks earlier so I decided to give it a try.
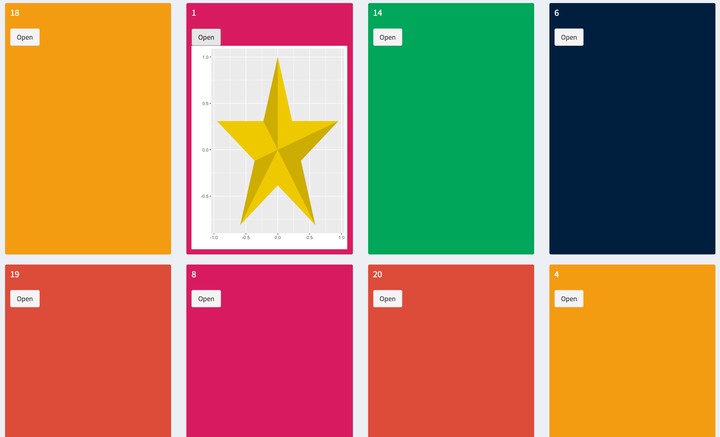
I’ve used Shiny Dashboard to make the basis of the advent calendar with 25 coloured “doors” (box) with Christmas themed ggplots which are revealed when you open (click an action button) a door.
Unlike a traditional chocolate advent calendar you can only open one door at a time (you also don’t get a chocolate, I’m a bit of a festive killjoy).
Some of the code and ideas for plots came from the following places:
http://t-redactyl.io/blog/2016/12/a-very-ggplot2-christmas.html
https://erle.io/blog/diy-hexbin-santa-claus/
https://blog.revolutionanalytics.com/2015/11/happy-thanksgiving.html.
I underestimated how long it would take to make 25 Christmas themed ggplots. I think when I started the quality of my plots steadily got better as I got more practice but towards the end it definitely goes down hill. I’ve shuffled my plots so you get a mix of good and bad. It’s just like Christmas though - you need to endure the sprouts to get the presents.
I had a go at deploying the app through shinyapps.io (https://kayleahaynes.shinyapps.io/advent/). It’s only on a free plan so there’s a chance it might not work.
Below is the source code. It’s not the best written piece of code but in hindsight I should have started this months ago.
Feel free to try it out on your own and even try and make your own version. Send me your Christmas themed R plots if you do give it a try.
Happy advent!
library(shiny)
library(shinydashboard)
library(tidyverse)
library(ggforce)
snow <- data.frame(x = rnorm(1000,0,1),
y = rnorm(1000,0,1))
ui <- dashboardPage(skin = "green",
dashboardHeader(title = "Advent CalendaR"),
dashboardSidebar(disable = TRUE),
dashboardBody(
fluidRow(
box(
title = "3", background = "navy", solidHeader = TRUE,
width = 3,
actionButton("box3", "Open"),
plotOutput("Plot3")
),
box(
title = "22", background = "green", solidHeader = TRUE,
width = 3,
actionButton("box22", "Open"),
plotOutput("Plot22")
),
box(
title = "11", background = "red", solidHeader = TRUE,
width = 3,
actionButton("box11", "Open"),
plotOutput("Plot11")
),
box(
title = "2", background = "maroon", solidHeader = TRUE,
width = 3,
actionButton("box2", "Open"),
plotOutput("Plot2")
)),
fluidRow(
column(width = 3),
column(width = 6,
box(
title = "25", background = "yellow", solidHeader = TRUE,
width = 12,
actionButton("box25", "Open"),
plotOutput("Plot25"),
)),
column(width= 3)),
fluidRow(
box(
title = "18", background = "yellow", solidHeader = TRUE,
width = 3,
actionButton("box18", "Open"),
plotOutput("Plot18")
),
box(
title = "1", background = "maroon", solidHeader = TRUE,
width = 3,
actionButton("box1", "Open"),
plotOutput("Plot1")
),
box(
title = "14", background = "green", solidHeader = TRUE,
width = 3,
actionButton("box14", "Open"),
plotOutput("Plot14")
),
box(
title = "6", background = "navy", solidHeader = TRUE,
width = 3,
actionButton("box6", "Open"),
plotOutput("Plot6")
)),
fluidRow(
box(
title = "19", background = "red", solidHeader = TRUE,
width = 3,
actionButton("box19", "Open"),
plotOutput("Plot19")
),
box(
title = "8", background = "maroon", solidHeader = TRUE,
width = 3,
actionButton("box8", "Open"),
plotOutput("Plot8")
),
box(
title = "20", background = "red", solidHeader = TRUE,
width = 3,
actionButton("box20", "Open"),
plotOutput("Plot20")
),
box(
title = "4", background = "yellow", solidHeader = TRUE,
width = 3,
actionButton("box4", "Open"),
plotOutput("Plot4")
)),
fluidRow(
box(
title = "16", background = "navy", solidHeader = TRUE,
width = 3,
actionButton("box16", "Open"),
plotOutput("Plot16")
),
box(
title = "5", background = "green", solidHeader = TRUE,
width = 3,
actionButton("box5", "Open"),
plotOutput("Plot5")
),
box(
title = "12", background = "yellow", solidHeader = TRUE,
width = 3,
actionButton("box12", "Open"),
plotOutput("Plot12")
),
box(
title = "7", background = "red", solidHeader = TRUE,
width = 3,
actionButton("box7", "Open"),
plotOutput("Plot7")
)),
fluidRow(
box(
title = "9", background = "red", solidHeader = TRUE,
width = 3,
actionButton("box9", "Open"),
plotOutput("Plot9")
),
box(
title = "24", background = "yellow", solidHeader = TRUE,
width = 3,
actionButton("box24", "Open"),
plotOutput("Plot24")
),
box(
title = "13", background = "maroon", solidHeader = TRUE,
width = 3,
actionButton("box13", "Open"),
plotOutput("Plot13")
),
box(
title = "15", background = "green", solidHeader = TRUE,
width = 3,
actionButton("box15", "Open"),
plotOutput("Plot15")
)),
fluidRow(
box(
title = "21", background = "navy", solidHeader = TRUE,
width = 3,
actionButton("box21", "Open"),
plotOutput("Plot21")
),
box(
title = "10", background = "red", solidHeader = TRUE,
width = 3,
actionButton("box10", "Open"),
plotOutput("Plot10")
),
box(
title = "17", background = "maroon", solidHeader = TRUE,
width = 3,
actionButton("box17", "Open"),
plotOutput("Plot17")
),
box(
title = "23", background = "yellow", solidHeader = TRUE,
width = 3,
actionButton("box23", "Open"),
plotOutput("Plot23")
)
),
h6("Some of the code and inspiration came from the following places: \n # http://t-redactyl.io/blog/2016/12/a-very-ggplot2-christmas.html \n
# https://erle.io/blog/diy-hexbin-santa-claus/ \n
# blog.revolutionanalytics.com")))
server <- function(input, output) {
early <- FALSE
message <- c("A Lump of coal for you",
"Bah-Humbug",
"Santa doesn't come to naughty boys or girls",
"What a scrooge",
"You're on the naughty list",
"Oi stop peeking",
"I wish it could be Christmas every day... but it's not!"
)
output$Plot1 <- renderPlot({
# Take a dependency on input$goButton. This will run once initially,
# because the value changes from NULL to 0.
req(input$box1 | lubridate::day(Sys.Date()) > 1)
validate(
need(lubridate::day(Sys.Date()) >= 1 | early == TRUE, sample(message,1))
)
r <- rep_len(c(100 , 100 * sin(pi / 10) / cos(pi / 5)), length.out = 11)/100
star <-
tibble(
x = r * sin(seq(0, 2 * pi, length.out = 11)),
y = r * cos(seq(0, 2 * pi, length.out = 11))
)
star2 <- rbind(star[1:3,], c(0,0), star[1,])
star3 <- rbind(star[5:7,], c(0,0), star[5,])
star4 <- rbind(star[8:10,], c(0,0), star[8,])
star %>%
ggplot(mapping = aes(x = x, y = y)) +
geom_polygon(fill = "gold3") +
geom_polygon(data = star2, fill = "gold2")+
geom_polygon(data = star3, fill = "gold2")+
geom_polygon(data = star4, fill = "gold2") +
xlab("") +
ylab("")
})
output$Plot2 <- renderPlot({
# Take a dependency on input$goButton. This will run once initially,
# because the value changes from NULL to 0.
req(input$box2 | lubridate::day(Sys.Date()) > 2)
validate(
need(lubridate::day(Sys.Date()) >= 2 | early == TRUE, sample(message,1))
)
height = 8
width = (height/8)*5
steps=50
size=3
ndecor=40
stepheight = height/steps
tree <- function(x) {
return(height - sign(x)*(2*height/width)*x)
}
slope = -(width/2)/height
data = data.frame()
for(i in seq(0, height, by=stepheight)) {
l = -(width/(2*height))*(-height + i)
n = 40*l
y = runif(n, i, i+stepheight)
x = runif(n, -l, l)
color = runif(n)
tempdata = data.frame(x, y, color)
data = rbind(data, tempdata)
}
xdecor = runif(ndecor, -width/2, width/2)
ydecor = runif(ndecor, 0, height)
colors = sample(c("A", "B", "C", "D"), size=ndecor, replace=TRUE)
decordata = data.frame(xdecor, ydecor, colors)
names(decordata) <- c("x", "y", "color")
decorations = subset(decordata, y < tree(x))
ggplot() +
geom_rect(aes(xmin = -0.5, xmax = 0.5, ymin= -1, ymax = 0), fill = "darkorange4") +
geom_point(data=data, aes(x=x, y=y, color=color), size=size) +
scale_color_continuous(low="#0F2E0F", high="#246B24", guide=FALSE) +
geom_point(aes(x = seq(-2.5, 1.8, 0.1), y = 1.5 + 0.5 * seq(-2.5, 1.8, 0.1), size = rnorm(length(seq(-2.5, 1.8, 0.1)), 1, 2)), col = "darkred") +
geom_point(aes(x = seq(-1.2, 1.8, 0.1), y = 3.5 - 0.5 * seq(-1.2, 1.8, 0.1), size = rnorm(length(seq(-1.2, 1.8, 0.1)), 1, 2)), col = "darkred") +
geom_point(aes(x = seq(-1.2, 0.9, 0.1), y = 5 + 0.5 * seq(-1.2, 0.9, 0.1), size = rnorm(length(seq(-1.2, 0.9, 0.1)), 1, 2)), col = "darkred") +
geom_point(data=data.frame(x = c(seq(-2.5, 2.5, 0.5)),
y = height - sign(c(seq(-2.5, 2.5, 0.5)))*(2*height/width)*c(seq(-2.5, 2.5, 0.5))), aes(x=x, y=y), size=4, color="gold") +
theme(legend.position = "none") +
xlab("") +
ylab("")
})
output$Plot3 <- renderPlot({
# Take a dependency on input$goButton. This will run once initially,
# because the value changes from NULL to 0.
req(input$box3 | lubridate::day(Sys.Date()) > 3)
validate(
need(lubridate::day(Sys.Date()) >= 3 | early == TRUE, sample(message,1))
)
lights <- data.frame(x = seq(1,20,0.01),
y = -0.6*sin(seq(1,20,0.01)) + 16)
ggplot() + scale_x_continuous(limits = c(0,20)) +
scale_y_continuous(limits = c(0,20)) +
geom_polygon(aes(x = x, y = y),
data = data.frame(x = c(7.5, 2.5, 4, 1, 2.5, 4, 4, 5,
12.5, 17.5, 16, 19, 17.5, 16, 16, 15),
y = c(12.5, 15, 15, 18, 17.5, 19, 16.5, 16,
12.5, 15, 15, 18, 17.5, 19, 16.5, 16),
group = c(1,1,1,1,1,1,1,1)), fill = "orangered4") +
geom_smooth(aes(x = x, y = y), data = lights, col = "black") +
geom_point(aes(x = x[10], y = y[10]), data = lights, col = "red", size =5) +
geom_point(aes(x = x[1000], y = y[1000]), data = lights, col = "red", size =5) +
geom_point(aes(x = x[500], y = y[500]), data = lights, col = "green", size =5) +
geom_point(aes(x = x[1900], y = y[1900]), data = lights, col = "green", size =5) +
geom_point(aes(x = x[200], y = y[200]), data = lights, col = "yellow", size =5) +
geom_point(aes(x = x[1400], y = y[1400]), data = lights, col = "yellow", size =5)+
geom_circle(aes(x0=10, y0=10, r = 5), fill = "tan3", colour = "black") +
geom_circle(aes(x0=10, y0=9, r = 2), fill = "red3", colour = "red3") +
geom_circle(aes(x0=9, y0=12, r = 0.6), fill = "tan", colour = "tan")+
geom_circle(aes(x0=11, y0=12, r = 0.6), fill = "tan", colour = "tan") +
geom_circle(aes(x0=9, y0=12, r = 0.4), fill = "black", colour = "black")+
geom_circle(aes(x0=11, y0=12, r = 0.4), fill = "black", colour = "black") +
geom_curve(aes(x = 8.5, xend = 11.5, y = 7, yend = 7)) +
theme_bw()
})
output$Plot4 <- renderPlot({
# Take a dependency on input$goButton. This will run once initially,
# because the value changes from NULL to 0.
req(input$box4| lubridate::day(Sys.Date()) > 4)
validate(
need(lubridate::day(Sys.Date()) >= 4 | early == TRUE, sample(message,1))
)
ggplot() + scale_x_continuous(limits = c(0,1)) +
scale_y_continuous(limits = c(0,1)) +
geom_rect(aes(xmin = 0, xmax = 1, ymin = 0.3, ymax = 1), fill = "grey94")+
geom_rect(aes(xmin = 0, xmax = 1, ymin = 0, ymax = 0.3), fill = "white") +
geom_point(aes(x = x, y = y), col = "white", data = snow) +
geom_rect(aes(xmin = 0.25, xmax = 0.35, ymin = 0.25, ymax = 0.75), fill = "tan3") +
geom_rect(aes(xmin = 0.27, xmax = 0.33, ymin = 0.27, ymax = 0.73), fill = "tan3", col = "white", size = 2) +
geom_rect(aes(xmin = 0.25, xmax = 0.75, ymin = 0.25, ymax = 0.6), fill = "tan3") +
geom_polygon(aes(x = x, y = y), data = data.frame(x = c(0.15, 0.5, 0.85), y = c(0.6, 0.8, 0.6)), fill = "tan3") +
geom_line(aes(x = c(0.27, 0.73), y = 0.27), col = "white", size = 2) +
geom_line(aes(x = c(0.27, 0.27), y = c(0.27, 0.58)), col = "white", size = 3) +
geom_line(aes(x = c(0.73, 0.73), y = c(0.27, 0.58)), col = "white", size = 3) +
geom_rect(aes(xmin = 0.45, xmax = 0.55, ymin = 0.27, ymax = 0.4), fill = "tan3", col = "white", size = 2) +
geom_line(aes(x = x, y = y), data = data.frame(x = seq(0.25,0.75,0.01), y = 0.6 + sin(50*seq(0.25,0.75,0.01))/100), col = "white", size = 3) +
geom_line(aes(x = x, y = y), data = data.frame(x = seq(0.22,0.51,0.01), y = 0.5 + 0.5*seq(0.22,0.51,0.01) + sin(50*seq(0.22,0.51,0.01))/100), col = "white", size = 3) +
geom_line(aes(x = x, y = y), data = data.frame(x = seq(0.50, 0.78, 0.01), y = 1 - 0.5*seq(0.50, 0.78,0.01) - sin(50*seq(0.50, 0.78,0.01))/100), col = "white", size = 3) +
geom_rect(aes(xmin = 0.3, xmax = 0.35, ymin = 0.45, ymax = 0.5), fill = "firebrick3") +
geom_rect(aes(xmin = 0.35, xmax = 0.4, ymin = 0.4, ymax = 0.45), fill = "firebrick3") +
geom_rect(aes(xmin = 0.3, xmax = 0.35, ymin = 0.4, ymax = 0.45), fill = "darkolivegreen1") +
geom_rect(aes(xmin = 0.35, xmax = 0.4, ymin = 0.45, ymax = 0.5), fill = "darkolivegreen1") +
geom_rect(aes(xmin = 0.6, xmax = 0.65, ymin = 0.45, ymax = 0.5), fill = "firebrick3") +
geom_rect(aes(xmin = 0.65, xmax = 0.7, ymin = 0.4, ymax = 0.45), fill = "firebrick3") +
geom_rect(aes(xmin = 0.6, xmax = 0.65, ymin = 0.4, ymax = 0.45), fill = "darkolivegreen1") +
geom_rect(aes(xmin = 0.65, xmax = 0.7, ymin = 0.45, ymax = 0.5), fill = "darkolivegreen1")
})
output$Plot5 <- renderPlot({
# Take a dependency on input$goButton. This will run once initially,
# because the value changes from NULL to 0.
req(input$box5| lubridate::day(Sys.Date()) > 5)
validate(
need(lubridate::day(Sys.Date()) >= 5 | early == TRUE, sample(message,1))
)
bell <- data.frame(x = 1:100000, y = rnorm(100000, 0.5, 0.1))
bell %>% ggplot() +
geom_density(aes(y), fill = "gold1", col = "black") +
ggtitle("JINGLE BELL CURVE") +
xlab("Jingle all the way")
})
output$Plot6 <- renderPlot({
# Take a dependency on input$goButton. This will run once initially,
# because the value changes from NULL to 0.
req(input$box6| lubridate::day(Sys.Date()) > 6)
validate(
need(lubridate::day(Sys.Date()) >= 6 | early == TRUE, sample(message,1))
)
ggplot() + scale_x_continuous(limits = c(0,16)) +
scale_y_continuous(limits = c(0,20)) +
geom_polygon(aes(x = x, y = y),
data = data.frame(x = c(5,7,7,6,8,10,9,9,11, 10, 12.5, 13, 16, 15, 13,11,14,11,13,15,16,13,12,10,11,9,9,10,8,6,7,7,5,6,4,3,0,1,3,5,2,5,4,1,0,3,4,6),
y= c(15,13,15,17,19,17,15,13,15,12.5, 13.5,15,15, 12,12,10.5,10,
9.5,8,8,5,5,6.5,7.5,5,7,5,3,1,3,5,7,5,7.5,6.5,5,5,8,8,9.5,10,10.5,12,12,15,15,13.5,12.5)), fill= "powderblue") +
geom_polygon(aes(x = x, y = y),
data = data.frame(x = c(8,8.5,11.5,9, 11.5,8.5,8,7.5,4.5,7,4.5,7.5),
y= c(14,11,12,10,8,9,6,9,8,10,12,11)), fill= "white") +
geom_polygon(aes(x = x, y = y, group = group),
data = data.frame(x = c(8,8.5,8,7.5, 8,8.5,8,7.5, 13.5, 14.5, 14, 13, 1.5, 2.5, 3, 2, 2, 3, 2.5,1.5, 13, 14, 14.5, 13.5),
y= c(18,17,16,17, 2,3,4,3, 14, 14, 13, 13, 14, 14, 13, 13, 7, 7, 6, 6, 7, 7, 6, 6),
group = c(1,1,1,1, 2,2,2,2, 3,3,3,3, 4,4,4,4, 5,5,5,5, 6,6,6,6)), fill= "white") +
theme_dark() +
xlab("") +
ylab("")
})
output$Plot7 <- renderPlot({
# Take a dependency on input$goButton. This will run once initially,
# because the value changes from NULL to 0.
req(input$box7| lubridate::day(Sys.Date()) > 7)
validate(
need(lubridate::day(Sys.Date()) >= 7 | early == TRUE, sample(message,1))
)
ggplot() + scale_x_continuous(limits = c(0,1)) +
scale_y_continuous(limits = c(0,1)) +
geom_rect(aes(xmin = 0, xmax = 1, ymin = 0, ymax = 1), fill = "white") +
geom_rect(aes(xmin = 0, xmax = 1, ymin = 0.15, ymax = 0.25), fill = "gray47") +
geom_rect(aes(xmin = 0.05, xmax = 0.95, ymin = 0.25, ymax = 1), fill = "gray76") +
geom_rect(aes(xmin = 0.25, xmax = 0.75, ymin = 0.25, ymax = 0.9), fill = "gray47") +
geom_point(aes(x = x, y= y, fill = col, size = col), data = data.frame(x = runif(1000, 0.25, 0.75),
y= runif(1000, 0.27, 0.3),
col = 1:5), shape=23) +
geom_point(aes(x = x, y= y, fill = col, size = col), data = data.frame(x = runif(1000, 0.22, 0.75),
y= runif(1000, 0.19, 0.23),
col = 1:5), shape=23) +
geom_rect(aes(xmin = 0.42, xmax = 0.58, ymin = 0.25, ymax = 0.75), fill = "darkred") +
geom_polygon(aes(x = x, y = y),
data = data.frame(x = c(0.42, 0.58, 0.5, 0.42),
y = c(0.75, 0.75, 0.79, 0.75)), fill = "darkred") +
geom_rect(aes(xmin = 0.52, xmax = 0.7, ymin = 0.22, ymax = 0.50), fill = "goldenrod") +
geom_polygon(aes(x = x, y = y),
data = data.frame(x = c(0.52, 0.7, 0.61, 0.52),
y = c(0.50, 0.50, 0.53, 0.50)), fill = "goldenrod") +
geom_point(aes(x = x, y= y, col = col), data = data.frame(x = runif(100, 0.48, 0.52),
y= runif(100, 0.79, 0.85),
col = 1:5), shape = 8) +
geom_point(aes(x = x, y= y, col = col), data = data.frame(x = runif(100, 0.60, 0.62),
y= runif(100, 0.53, 0.56),
col = 1:5), shape = 8) +
scale_color_gradient(low="yellow", high="darkorange") +
geom_point(aes(x = x, y= y, fill = col, size = col), data = data.frame(x = runif(1000, 0.20, 0.8),
y= runif(1000, 0.20, 0.27),
col = 1:5), shape=23) +
scale_fill_gradient(low="springgreen2", high="darkgreen") +
xlab("") +
ylab("") +
theme_bw() +
theme(legend.position = "none")
})
output$Plot8 <- renderPlot({
# Take a dependency on input$goButton. This will run once initially,
# because the value changes from NULL to 0.
req(input$box8| lubridate::day(Sys.Date()) > 8)
validate(
need(lubridate::day(Sys.Date()) >= 8 | early == TRUE, sample(message,1))
)
ggplot() + scale_x_continuous(limits = c(0,1)) +
scale_y_continuous(limits = c(0,1)) +
geom_rect(aes(xmin = 0, xmax = 1, ymin = 0.3, ymax = 1), fill = "skyblue")+
geom_rect(aes(xmin = 0, xmax = 1, ymin = 0, ymax = 0.3), fill = "white") +
geom_point(aes(x = x, y = y), col = "white", data = snow) +
geom_polygon(aes(x = x, y = y, group = group),
data = data.frame(x = c(0.3, 0.3, 0.15, 0.7, 0.7, 0.85),
y = c(0.4, 0.65, 0.4, 0.4, 0.65, 0.4),
group = c(1,1,1, 2, 2, 2)), fill = "tan3", col = "black") +
geom_line(aes(x = x, y = y, group = group), data =
data.frame(x = c(0.45, 0.45, 0.55,0.55, 0.45, 0.42, 0.45, 0.48, 0.55, 0.52, 0.55, 0.58),
y = c(0.3, 0.2, 0.3, 0.2, 0.2, 0.16, 0.2, 0.16, 0.2, 0.16, 0.2, 0.16),
group = c(1,1, 2, 2, 3, 3, 4, 4, 5, 5, 6, 6)), size = 1) +
geom_circle(aes(x0=0.5, y0=0.5, r = 0.25), fill = "tan3", colour = "black") +
geom_circle(aes(x0=0.5, y0=0.4, r = 0.15), fill = "tan", colour = "tan") +
geom_circle(aes(x0=0.5, y0=0.43, r = 0.12), fill = "red3", colour = "red3") +
geom_polygon(aes(x = x, y = y), data = data.frame(x = c(0.5, 0.45, 0.55),
y = c(0.56, 0.62, 0.62)), fill = "orange") +
geom_circle(aes(x0=0.45, y0=0.65, r = 0.01), fill = "black", colour = "black")+
geom_circle(aes(x0=0.55, y0=0.65, r = 0.01), fill = "black", colour = "black") +
xlab("") +
ylab("")
})
output$Plot9 <- renderPlot({
# Take a dependency on input$goButton. This will run once initially,
# because the value changes from NULL to 0.
req(input$box9| lubridate::day(Sys.Date()) > 9)
validate(
need(lubridate::day(Sys.Date()) >= 9 | early == TRUE, sample(message,1))
)
set.seed(2512)
fur <- data.frame(x = runif(1000,9,18),
y = runif(1000,13,16),
size = runif(1000,0,1))
stars <- data.frame(x = runif(70,10,17),
y = runif(70,3,13))
stars2 <- data.frame(x = runif(30,5,10),
y = runif(30,2.5,7))
ggplot() + scale_x_continuous(limits = c(0,20)) +
scale_y_continuous(limits = c(0,20)) +
geom_rect(aes(xmin = 0, xmax = 20, ymin = 0, ymax = 20), , fill = "seagreen3") +
geom_rect(aes(xmin = 10, xmax = 17.5, ymin = 2.5, ymax = 15), , fill = "maroon") +
geom_rect(aes(xmin = 5, xmax = 10, ymin = 2.5, ymax = 7.5), fill = "maroon") +
geom_circle(aes(x0=5, y0=5, r = 2.4), fill = "maroon", col = "maroon") +
geom_curve(aes(x = 16, xend = 17.8, y = 2.2, yend = 5), col = "seagreen3", size = 6) +
geom_point(aes(x = x, y =y), data = stars, col = "maroon4", shape = 11, size = 2)+
geom_point(aes(x = x, y =y), data = stars2, col = "maroon4", shape = 11, size = 2) +
geom_point(aes(x = x, y = y, size = size), data = fur, col = "white") +
theme(legend.position = "none") +
xlab("") +
ylab("")
})
output$Plot10 <- renderPlot({
# Take a dependency on input$goButton. This will run once initially,
# because the value changes from NULL to 0.
req(input$box10| lubridate::day(Sys.Date()) > 10)
validate(
need(lubridate::day(Sys.Date()) >= 10 | early == TRUE, sample(message,1))
)
r <- rep_len(c(40, 40 * sin(pi / 10) / cos(pi / 5)), length.out = 11)/100
star <-
tibble(
x = r * sin(seq(0, 2 * pi, length.out = 11)),
y = r * cos(seq(0, 2 * pi, length.out = 11))
)
star2 <- rbind(star[1:3,], c(0,0), star[1,])
star3 <- rbind(star[5:7,], c(0,0), star[5,])
star4 <- rbind(star[8:10,], c(0,0), star[8,])
ggplot() +
geom_point(aes(x = 0, y = 0), shape = 19, col = "darkgoldenrod", size = 90) +
geom_point(aes(x = 0, y = 0), shape = 19, col = "darkred", size = 80) +
geom_polygon(data = star, aes(x = x, y = y), fill = "gold3") + scale_x_continuous(limits = c(-1,1)) +
scale_y_continuous(limits = c(-1,1)) +
xlab("") +
ylab("") +
geom_polygon(data = star2, aes(x = x, y = y), fill = "darkgoldenrod")+
geom_polygon(data = star3, aes(x = x, y = y), fill = "darkgoldenrod")+
geom_polygon(data = star4, aes(x = x, y = y), fill = "darkgoldenrod") +
ggtitle("Mince Pie Chart")
})
output$Plot11 <- renderPlot({
# Take a dependency on input$goButton. This will run once initially,
# because the value changes from NULL to 0.
req(input$box11| lubridate::day(Sys.Date()) > 11)
validate(
need(lubridate::day(Sys.Date()) >= 11 | early == TRUE, sample(message,1))
)
ggplot() + scale_x_continuous(limits = c(0,1)) +
scale_y_continuous(limits = c(0,1)) +
geom_rect(aes(ymin = 0.4, ymax = 0.9, xmax = 0.9, xmin = 0.4), fill = "red") +
geom_rect(aes(ymin = 0.30, ymax = 0.75, xmax = 0.10, xmin = 0.5), fill = "navy") +
geom_rect(aes(xmin = 0.05, xmax = 0.95, ymax = 0.40, ymin = 0.2), fill = "forestgreen") +
geom_rect(aes(xmin = 0.25, xmax = 0.3, ymax = 0.75, ymin = 0.4), fill = "snow3") +
geom_rect(aes(ymin = 0.65, ymax = 0.68, xmax = 0.10, xmin = 0.5), fill = "snow3") +
geom_rect(aes(xmin = 0.65, xmax = 0.69, ymax = 0.9, ymin = 0.4), fill = "gold3") +
geom_rect(aes(ymin = 0.62, ymax = 0.65, xmax = 0.50, xmin = 0.9), fill = "gold3") +
geom_rect(aes(xmin = 0.05, xmax = 0.95, ymax = 0.3, ymin = 0.32), fill = "darkred") +
geom_rect(aes(ymin = 0.20, ymax = 0.4, xmax = 0.74, xmin = 0.76), fill = "darkred") +
theme_bw()
})
output$Plot12 <- renderPlot({
# Take a dependency on input$goButton. This will run once initially,
# because the value changes from NULL to 0.
req(input$box12| lubridate::day(Sys.Date()) > 12)
validate(
need(lubridate::day(Sys.Date()) >= 12 | early == TRUE, sample(message,1))
)
ggplot() + scale_x_continuous(limits = c(0,20)) +
scale_y_continuous(limits = c(0,20)) +
geom_rect(aes(xmin = 0, xmax = 20, ymin = 0, ymax = 20), fill = "lightseagreen") +
geom_rect(aes(xmin = 2, xmax = 18, ymin = 12, ymax = 14), fill = "tan3") +
geom_circle(aes(x0=10, y0=16, r = 2.5), fill = "tan3", colour = "tan3") +
geom_rect(aes(xmin = 7.5, xmax = 12.5, ymin = 7.5, ymax = 12.5), fill = "tan3") +
geom_circle(aes(x0=2, y0=13, r = 1), fill = "tan3", colour = "tan3")+
geom_circle(aes(x0=18, y0=13, r = 1), fill = "tan3", colour = "tan3") +
geom_polygon(aes(x=x, y = y, group = group), data = data.frame(x = c(7.5, 6, 9, 10, 12.5, 14, 11, 10),
y = c(7.5, 2.5, 2.5, 7.5, 7.5, 2.5, 2.5, 7.5),
group = c(1,1,1,1,
2,2,2,2)), fill = "tan3") +
geom_circle(aes(x0=7.5, y0=2.6, r = 1.4), fill = "tan3", colour = "tan3")+
geom_circle(aes(x0=12.5, y0=2.6, r = 1.4), fill = "tan3", colour = "tan3")+
geom_circle(aes(x0=10, y0=12, r = 0.5), fill = "red", colour = "red")+
geom_circle(aes(x0=10, y0=10, r = 0.5), fill = "darkgreen", colour = "darkgreen") +
geom_circle(aes(x0=9, y0=17, r = 0.4), fill = "white", colour = "white")+
geom_circle(aes(x0=11, y0=17, r = 0.4), fill = "white", colour = "white") +
geom_curve(aes(x = 8.5, xend = 11.5, y = 15, yend = 15), col = "white", size = 2) +
geom_curve(aes(x = 2, xend = 2, y = 12.5, yend = 13.5),curvature = -0.5, col = "white", size = 2) +
geom_curve(aes(x = 18, xend = 18, y = 12.5, yend = 13.5),curvature = 0.5, col = "white", size = 2) +
geom_curve(aes(x = 11.5, xend = 13.5, y = 2, yend = 2),curvature = 0.5, col = "white", size = 2) +
geom_curve(aes(x = 6.5, xend = 8.5, y = 2, yend = 2),curvature = 0.5, col = "white", size = 2)
})
output$Plot13 <- renderPlot({
# Take a dependency on input$goButton. This will run once initially,
# because the value changes from NULL to 0.
req(input$box13| lubridate::day(Sys.Date()) > 13)
validate(
need(lubridate::day(Sys.Date()) >= 13 | early == TRUE, sample(message,1))
)
ggplot() + scale_x_continuous(limits = c(0,14)) +
scale_y_continuous(limits = c(0,14)) +
geom_rect(aes(xmin = 0, xmax = 14, ymin = 0, ymax = 14), fill = "white") +
geom_polygon(aes(x = x,y = y ), fill = "springgreen3", col = "darkgreen", data =
data.frame(x = c(5, 8, 9, 11, 13, 11, 8, 7, 5),
y = c(5.0, 7.0, 6.0, 6,4.0, 2.0, 4.0, 2.5, 5))) +
geom_polygon(aes(x = x,y = y ), fill = "springgreen3", col = "darkgreen", data =
data.frame(x = c(4, 1.7, 3.7, 1, 3.4, 3.1, 4.7, 6.5, 5.4, 7.4, 5.2),
y = c(6, 7.9, 7.9, 10.6, 10.5, 13.4, 11, 12, 8.5, 8.5, 5.3))) +
geom_line(aes(x = x, y = y, group = group), data = data.frame(x = c(5, 8, 8,13, 8, 8.2, 10, 11, 10, 11, 8, 9, 5, 3.5, 4.7, 6, 4.7, 3.5, 4.2, 6, 4.2, 2.5), y = c(5, 5, 5, 4, 5, 6.5, 4.5,5.5, 4.5, 2.5, 5, 4, 5, 12, 6.5, 8, 6.5, 7, 9, 11, 9, 10), group = c(1,1,2,2, 3, 3, 4, 4, 5, 5, 6, 6, 7, 7, 8, 8, 9, 9, 10, 10, 11, 11)), col = "darkgreen", size = 1) +
geom_circle(aes(x0=5, y0=5.5, r = 1), fill = "firebrick3", colour = "black") +
geom_circle(aes(x0=4.5, y0=4, r = 1), fill = "firebrick3", colour = "black")+
geom_circle(aes(x0=6, y0=4.5, r = 1), fill = "firebrick3", colour = "black") +
xlab("") +
ylab("")
})
output$Plot14 <- renderPlot({
# Take a dependency on input$goButton. This will run once initially,
# because the value changes from NULL to 0.
req(input$box14| lubridate::day(Sys.Date()) > 14)
validate(
need(lubridate::day(Sys.Date()) >= 14 | early == TRUE, sample(message,1))
)
## R script and data by Kieran Healey
## https://twitter.com/kjhealy/status/669567682178654208
datafile = "blog.revolutionanalytics.com/downloads/tdata.csv"
library(ggplot2)
x = read.csv(paste0("http://",datafile))
ggplot(x) + geom_tile(aes(x=H,y=T,fill=tc))+scale_fill_identity()
})
output$Plot15 <- renderPlot({
# Take a dependency on input$goButton. This will run once initially,
# because the value changes from NULL to 0.
req(input$box15| lubridate::day(Sys.Date()) > 15)
validate(
need(lubridate::day(Sys.Date()) >= 15 | early == TRUE, sample(message,1))
)
ggplot() + scale_x_continuous(limits = c(0,10)) +
scale_y_continuous(limits = c(0,10)) +
geom_rect(aes(xmin = 0, xmax = 10, ymin = 0, ymax = 10), fill = "white") +
geom_point(aes(x = x, y = y, col = size, size = size), data = data.frame(x = seq(0,10,0.1), y = 0.5, size = rnorm(101, 1,2))) +
geom_point(aes(x = x, y = y, col = size, size = size), data = data.frame(x = seq(0,10,0.1), y = 0.7, size = rnorm(101, 1,2)))+
geom_point(aes(x = x, y = y, col = size, size = size), data = data.frame(x = seq(0,9,0.1), y = 1*seq(0,9,0.1), size = rnorm(91, 1,2)))+
geom_point(aes(x = x, y = y, col = size, size = size), data = data.frame(x = seq(0,9,0.1), y = 0.2 + 1*seq(0,9,0.1), size = rnorm(91, 1,2))) +
scale_colour_gradient(low="snow3", high="snow1") +
ggtitle("Snow Angle") +
theme(legend.position = "none") +
geom_curve(aes(x = 2.5, xend = 2, y = 0.8, yend = 2), curvature = 1, col = "grey")
})
output$Plot16 <- renderPlot({
# Take a dependency on input$goButton. This will run once initially,
# because the value changes from NULL to 0.
req(input$box16| lubridate::day(Sys.Date()) > 16)
validate(
need(lubridate::day(Sys.Date()) >= 16 | early == TRUE, sample(message,1))
)
candy <- data.frame(x = c(1,2,3),
y = c(3,2,3))
candy2 <- data.frame(x = c(1,3,4,2),
y = c(3,3,4,4))
candy3 <- data.frame(x = c(8,9,9),
y = c(15,14,16))
ggplot() + scale_x_continuous(limits = c(0,17)) +
scale_y_continuous(limits = c(0,17)) +
geom_polygon(aes(x,y), data = candy, fill = "red", col = "black") +
geom_polygon(aes(x,y), data = candy2, fill = "white", col = "black") +
geom_polygon(aes(x + 1,y + 1), data = candy2, fill = "red", col = "black")+
geom_polygon(aes(x + 2,y + 2), data = candy2, fill = "white", col = "black") +
geom_polygon(aes(x + 3,y + 3), data = candy2, fill = "red", col = "black") +
geom_polygon(aes(x + 4,y + 4), data = candy2, fill = "white", col = "black")+
geom_polygon(aes(x + 5,y + 5), data = candy2, fill = "red", col = "black")+
geom_polygon(aes(x + 6,y + 6), data = candy2, fill = "white", col = "black") +
geom_polygon(aes(x + 7,y + 7), data = candy2, fill = "red", col = "black") +
geom_polygon(aes(x + 8,y + 8), data = candy2, fill = "white", col = "black") +
geom_polygon(aes(x + c(9,9,8.5,9),y + c(9,9,9,9)), data = candy2, fill = "red", col = "black") +
geom_polygon(aes(x + c(10,9.5,8.5,9),y + c(10,10,10,10)), data = candy2, fill = "white", col = "black") +
geom_polygon(aes(x + c(10,9.5,8.25,9),y + c(11,11,11,10.5)), data = candy2, fill = "red", col = "black") +
geom_polygon(aes(x + c(10,9.25,7.25,8.75),y + c(11.5,12,12,10.75)), data = candy2, fill = "white", col = "black")+
geom_polygon(aes(x,y), data = candy3, fill = "red", col = "black") +
geom_polygon(aes(x + c(8,7,6,7),y + c(11, 12, 12.25, 12)), data = candy2, fill = "white", col = "black")+
geom_polygon(aes(x + c(9,7.75,7.25,8),y + c(12, 11.75, 12, 12.25)), data = candy2, fill = "red", col = "black")
})
output$Plot17 <- renderPlot({
# Take a dependency on input$goButton. This will run once initially,
# because the value changes from NULL to 0.
req(input$box17| lubridate::day(Sys.Date()) > 17)
validate(
need(lubridate::day(Sys.Date()) >= 17 | early == TRUE, sample(message,1))
)
ggplot() + scale_x_continuous(limits = c(0,1)) +
scale_y_continuous(limits = c(0,1)) +
geom_rect(aes(xmin = 0, xmax = 1, ymin = 0.3, ymax = 1), fill = "grey94")+
geom_rect(aes(xmin = 0, xmax = 1, ymin = 0, ymax = 0.3), fill = "white") +
geom_point(aes(x = x, y = y), col = "white", data = snow) +
geom_polygon(aes(x = x, y = y, group = group),
data = data.frame(x = c(0.3, 0.3, 0.15, 0.7, 0.7, 0.85),
y = c(0.4, 0.65, 0.4, 0.4, 0.65, 0.4),
group = c(1,1,1, 2, 2, 2)), fill = "black", col = "black") +
geom_polygon(aes(x = x, y = y, group = group),
data = data.frame(x = c(0.42,0.38, 0.42,0.46, 0.42, c(0.42,0.38, 0.42,0.46, 0.42)+0.15),
y = c(0.3, 0.22, 0.25, 0.22,0.3, 0.3, 0.22, 0.25, 0.22,0.3),
group = c(1,1,1,1,1,
2,2,2,2,2)),fill = "orange") +
geom_circle(aes(x0=0.5, y0=0.5, r = 0.25), fill = "black", colour = "black") +
geom_circle(aes(x0=0.5, y0=0.49, r = 0.23), fill = "white", colour = "white") +
geom_polygon(aes(x = x, y = y), data = data.frame(x = c(0.5, 0.45, 0.55),
y = c(0.56, 0.62, 0.62)), fill = "orange") +
geom_circle(aes(x0=0.45, y0=0.65, r = 0.01), fill = "black", colour = "black")+
geom_circle(aes(x0=0.55, y0=0.65, r = 0.01), fill = "black", colour = "black") +
geom_circle(aes(x0=0.4, y0=0.6, r = 0.02), fill = "pink", colour = "pink")+
geom_circle(aes(x0=0.6, y0=0.6, r = 0.02), fill = "pink", colour = "pink") +
xlab("") +
ylab("")
})
output$Plot18 <- renderPlot({
# Take a dependency on input$goButton. This will run once initially,
# because the value changes from NULL to 0.
req(input$box18| lubridate::day(Sys.Date()) > 18)
validate(
need(lubridate::day(Sys.Date()) >= 18 | early == TRUE, sample(message,1))
)
ggplot() +
geom_circle(aes(x0 = 0.5, y0 = 0.5, r = 0.5), fill = "darkgreen") +
geom_point(aes(x=0.5, y=0.5), size=20, shape=18, color = "gold2") +
geom_point(aes(x=0.69, y=0.5), size=20, shape=18, color = "gold2")+
geom_point(aes(x=0.31, y=0.5), size=20, shape=18, color = "gold2")+
geom_point(aes(x=0.87, y=0.5),size=20, shape=18, color = "gold2")+
geom_point(aes(x=0.1, y=0.5), size=20, shape=18, color = "gold2") +
geom_line(aes(x, y), data=data.frame(x = c(0.07,0.93), y = c(0.7,0.7)), size=2, color = "gold4") +
geom_line(aes(x, y), data=data.frame(x = c(0.07,0.93), y = c(0.3,0.3)), size=2, color = "gold4") +
geom_rect(aes(ymin = 1, ymax= 1.05, xmax = 0.55, xmin = 0.45), fill = "gold1") +
theme_bw() +
ylab("") +
xlab("")
})
output$Plot19 <- renderPlot({
# Take a dependency on input$goButton. This will run once initially,
# because the value changes from NULL to 0.
req(input$box19| lubridate::day(Sys.Date()) > 19)
validate(
need(lubridate::day(Sys.Date()) >= 19 | early == TRUE, sample(message,1))
)
arms <- data.frame(x = c(0.1, 0.9, 0.1, 0.15, 0.85, 0.9), y = c(0.6, 0.6, 0.65, 0.6, 0.6, 0.65), group = c(1,1,2,2, 3,3))
nose <- data.frame(x = c(0.49, 0.49, 0.54), y = c(0.84, 0.81, 0.83))
scarf <- data.frame(x = seq(0.36, 0.64, 0.001), y = rnorm(length(seq(0.36, 0.64, 0.001)), 0.72, 0.01), size = rnorm(length(seq(0.36, 0.64, 0.001)),0,1))
scarf2 <- data.frame(y = seq(0.5, 0.7, 0.0001), x = rnorm(length(seq(0.5, 0.7, 0.0001)), 0.6, 0.01), size = rnorm(length(seq(0.5, 0.7, 0.0001)),0,1))
ggplot() + scale_x_continuous(limits = c(0,1)) +
scale_y_continuous(limits = c(0,1)) +
geom_line(aes(x, y, group = group), data = arms, size = 2, color = "brown")+
geom_circle(aes(x0=0.5, y0=0.25, r = 0.25), fill = "white", colour = "white") +
geom_circle(aes(x0=0.5, y0=0.55, r = 0.2), fill = "white", colour = "white") +
geom_circle(aes(x0=0.5, y0=0.80, r = 0.15), fill = "white", colour = "white") +
geom_circle(aes(x0=0.5, y0=0.60, r = 0.02), fill = "black", colour = "black") +
geom_circle(aes(x0=0.5, y0=0.45, r = 0.02), fill = "black", colour = "black")+
geom_circle(aes(x0=0.5, y0=0.3, r = 0.02), fill = "black", colour = "black")+
geom_circle(aes(x0=0.45, y0=0.87, r = 0.01), fill = "black", colour = "black")+
geom_circle(aes(x0=0.55, y0=0.87, r = 0.01), fill = "black", colour = "black") +
geom_rect(aes(xmin = 0.33, xmax = 0.68, ymin= 0.90, ymax = 0.94), fill = "black") +
geom_rect(aes(xmin = 0.38, xmax = 0.62, ymin= 0.94, ymax = 1), fill = "black") +
geom_polygon(aes(x = x, y = y), data = nose, fill = "orange") +
geom_point(aes(x=x, y = y, color = size), data = scarf, size = 2, shape = 19) +
geom_point(aes(x=x, y = y, color = size), data = scarf2, size = 2, shape = 19) +
theme(legend.position = "none") +
xlab("") +
ylab("")
})
output$Plot20 <- renderPlot({
# Take a dependency on input$goButton. This will run once initially,
# because the value changes from NULL to 0.
req(input$box20| lubridate::day(Sys.Date()) > 20)
validate(
need(lubridate::day(Sys.Date()) >= 20 | early == TRUE, sample(message,1))
)
x = seq(0, 10, by = 0.01)
log_df <- data.frame(x, y = dlnorm(x), key = "LOG")
log_df %>% ggplot() +
geom_line(aes(x = x, y = y, col= key), size = 1) +
scale_color_manual(values = "red") +
xlab("X(mas)") +
ylab("Y(ule)") +
theme_light() +
theme(legend.title = element_blank())
})
output$Plot21 <- renderPlot({
# Take a dependency on input$goButton. This will run once initially,
# because the value changes from NULL to 0.
req(input$box21| lubridate::day(Sys.Date()) > 21)
validate(
need(lubridate::day(Sys.Date()) >= 21 | early == TRUE, sample(message,1))
)
ggplot() + scale_x_continuous(limits = c(0,10)) +
scale_y_continuous(limits = c(0,10)) +
geom_rect(aes(xmin = 0, xmax = 10, ymin = 0, ymax = 10), fill = "white") +
geom_circle(aes(x0=5, y0=5, r = 3), fill = "lightsalmon4", col = "lightsalmon4") +
geom_rect(aes(xmin = 0, xmax = 10, ymin = 5, ymax = 10), fill = "white") +
geom_circle(aes(x0=5, y0=5, r = 3), col = "lightsalmon4") +
geom_line(aes(x = x, y = y), data = data.frame(x = seq(2,8,0.1), y = 5 + sin(8*seq(2,8,0.1))/10), col = "white", size = 4) +
geom_circle(aes(x0=5, y0=8, r = 0.3), col = "firebrick3", fill = "firebrick3") +
geom_circle(aes(x0=4.5, y0=7.8, r = 0.3), col = "firebrick3", fill = "firebrick3") +
geom_circle(aes(x0=5.1, y0=7.6, r = 0.3), col = "firebrick3", fill = "firebrick3")
})
output$Plot22 <- renderPlot({
# Take a dependency on input$goButton. This will run once initially,
# because the value changes from NULL to 0.
req(input$box22| lubridate::day(Sys.Date()) > 22)
validate(
need(lubridate::day(Sys.Date()) >= 22 | early == TRUE, sample(message,1))
)
ggplot() + scale_x_continuous(limits = c(0,1)) +
scale_y_continuous(limits = c(0,1)) +
geom_rect(aes(xmin = 0, xmax = 1, ymin = 0, ymax = 1), fill = "skyblue")+
geom_point(aes(x = x, y = y), col = "white", data = snow) +
geom_circle(aes(x0=0.2, y0=0.3, r = 0.1), fill = "white", colour = "white") +
geom_circle(aes(x0=0.27, y0=0.29, r = 0.07), fill = "white", colour = "white") +
geom_circle(aes(x0=0.29, y0=0.31, r = 0.03), fill = "gray90", colour = "gray90") +
geom_point(aes(x = x, y = y, size = size), col = "white", data = data.frame(x = runif(10000, 0, 1),
y = runif(10000, 0,0.29),
size = rnorm(10000,0,1))) +
geom_rect(aes(xmin = 0.46, xmax = 0.54, ymin = 0.25, ymax = 0.75), fill = "white") +
geom_polygon(aes(x = x, y = y),
data = data.frame(x = c(0.46, 0.54, 0.54, 0.46),
y = c(0.25, 0.30, 0.35, 0.30)), fill = "red") +
geom_polygon(aes(x = x, y = y),
data = data.frame(x = c(0.46, 0.54, 0.54, 0.46),
y = c(0.25, 0.30, 0.35, 0.30) + 0.1), fill = "red") +
geom_polygon(aes(x = x, y = y),
data = data.frame(x = c(0.46, 0.54, 0.54, 0.46),
y = c(0.25, 0.30, 0.35, 0.30) + 0.2), fill = "red") +
geom_polygon(aes(x = x, y = y),
data = data.frame(x = c(0.46, 0.54, 0.54, 0.46),
y = c(0.25, 0.30, 0.35, 0.30) + 0.4), fill = "red") +
geom_line(aes(x = x, y = y, group = group), data = data.frame(x = c(0.12, 0.12, 0.14, 0.14, 0.16, 0.16, 0.18, 0.18, 0.20, 0.2, 0.22, 0.22, 0.24, 0.24, 0.15, 0.25, 0.13, 0.27, 0.11, 0.25, 0.1, 0.25, 0.1, 0.25),
y = c(0.3, 0.35, 0.3, 0.37, 0.3, 0.39, 0.3, 0.39, 0.3, 0.39, 0.3, 0.39, 0.3, 0.39, 0.39, 0.39, 0.37, 0.37, 0.35, 0.35, 0.33, 0.33, 0.31, 0.31),
group = c(1,1, 2, 2, 3, 3, 4,4,5,5,6,6,7,7, 8, 8, 9, 9, 10, 10, 11, 11, 12, 12)), col = "gray90") +
geom_circle(aes(x0=0.5, y0=0.75, r = 0.07), fill = "firebrick3", colour = "firebrick3") +
geom_rect(aes(xmin = 0.44, xmax = 0.56, ymin = 0.66, ymax = 0.70), fill = "firebrick3") +
geom_rect(aes(xmin = 0.35, xmax = 0.65, ymin = 0.50, ymax = 0.65), fill = "firebrick3") +
geom_rect(aes(xmin = 0.36, xmax = 0.64, ymin = 0.51, ymax = 0.64), fill = "white") +
annotate("text", x = 0.5, y = 0.6, label = "North", size = 8) +
annotate("text", x = 0.5, y = 0.55, label = "Pole", size = 8) +
theme(legend.position = "none") +
xlab("") +
ylab("")
})
output$Plot23 <- renderPlot({
# Take a dependency on input$goButton. This will run once initially,
# because the value changes from NULL to 0.
req(input$box23| lubridate::day(Sys.Date()) > 23)
validate(
need(lubridate::day(Sys.Date()) >= 23 | early == TRUE, sample(message,1))
)
ggplot() + scale_x_continuous(limits = c(0,22)) +
scale_y_continuous(limits = c(0,18)) +
geom_point(aes(x=x, y = y, col = col), data = data.frame(x = rnorm(1000,10, 2), y = rnorm(1000, 10, 2), col = rnorm(100,10,2))) +
scale_colour_gradient(low="yellow", high="goldenrod2") +
geom_polygon(aes(x = x, y = y),
data = data.frame(x = c(4, 8, 8, 9.2, 9, 10, 5.8, 4),
y = c(8, 11, 9.6, 9.2, 8.3, 7.7, 5.2, 6)), fill = "red4") +
geom_polygon(aes(x = x, y = y),
data = data.frame(x = c(4, 2.2, 0.4, 1.4, 4),
y = c(6, 6.3, 4.7, 2.3, 4)), fill = "red4") +
geom_polygon(aes(x = x, y = y),
data = data.frame(x = c(12.7, 10, 11.6, 11, 12.5, 12.2, 16.8, 17, 15),
y = c(13.4, 11.6, 11, 10, 9.8, 8.7, 11.7, 14, 14.5)), fill = "red4") +
geom_polygon(aes(x = x, y = y),
data = data.frame(x = c(17.4, 19.3, 21.2, 19.5, 17),
y = c(15.6, 17, 14.5, 13.4, 14)), fill = "red4") +
geom_line(aes(x = c(0.4, 1.4), y = c(4.7, 2.3)), col = "lightgoldenrod2", size = 1, linetype = 3) +
geom_line(aes(x = c(19.3, 21.2), y = c(17, 14.5)), col = "lightgoldenrod2", size = 1, linetype = 3) +
geom_line(aes(x = c(3, 5), y = c(7, 5)), col = "lightgoldenrod2", size = 2) +
geom_line(aes(x = c(16, 18), y = c(15, 13)), col = "lightgoldenrod2", size = 2) +
theme_bw()
})
output$Plot24 <- renderPlot({
# Take a dependency on input$goButton. This will run once initially,
# because the value changes from NULL to 0.
req(input$box24| lubridate::day(Sys.Date()) > 24)
validate(
need(lubridate::day(Sys.Date()) >= 24 | early == TRUE, sample(message,1))
)
data1 <- data.frame(x = rnorm(10000,0,1),
y = rnorm(10000,0,1),
col = c(1:5))
data2 <- data.frame(x = rnorm(100000,0,1),
y = rnorm(100000,0,1),
col = c(1:5))
filtered_df1 <- data1[sqrt(abs(data1$x - 0.5)^2 + abs(data1$y - 0.5)^2) < 0.5,]
filtered_df2 <- data2[sqrt(abs(data2$x - 0.5)^2 + abs(data2$y - 0.5)^2) < 0.5,]
ggplot()+ scale_x_continuous(limits = c(0,1)) +
scale_y_continuous(limits = c(0,1.2)) +
geom_circle(aes(x0 = 0.5, y0 = 0.5, r = 0.5), fill = "darkgreen") +
theme_bw() +
geom_point(aes(x = x, y = y, col = col, size = col), data = filtered_df2) +
geom_point(aes(x = x, y = y), data = filtered_df1, col = "white") +
geom_circle(aes(x0 = 0.5, y0 = 0.5, r = 0.3), fill = "white", col = "white") +
scale_color_gradient(low="springgreen4", high="darkgreen") +
ylab("") +
xlab("")+
geom_circle(aes(x0 = 0.5, y0 = 1, r = 0.1), fill = "darkred", colour = "darkred") +
geom_polygon(aes(x, y), data = data.frame(x = c(0.5, 0.75, 0.75), y = c(1, 1.2, 0.8)), fill = "darkred", colour = "darkred") +
geom_polygon(aes(x, y), data = data.frame(x = c(0.5, 0.25, 0.25), y = c(1, 1.2, 0.8)), fill = "darkred", colour = "darkred") +
theme(legend.position = "none")
})
output$Plot25 <- renderPlot({
# Take a dependency on input$goButton. This will run once initially,
# because the value changes from NULL to 0.
req(input$box25| lubridate::day(Sys.Date()) > 25)
validate(
need(lubridate::day(Sys.Date()) >= 25 | early == TRUE, sample(message,1))
)
height = 3
width = (height/8)*4
steps=20
size=10
stepheight = height/steps
beard <- function(x) {
return(height - sign(x)*(2*height/width)*x)
}
slope = -(width)/height
data = data.frame()
for(i in seq(0, height, by=stepheight)) {
l = (width/(2*height))*(height + i)
n = 40*l
y = 3 + runif(n, i, i+stepheight)
x = 5 + runif(n, -l, l)
color = runif(n)
tempdata = data.frame(x, y, color)
data = rbind(data, tempdata)
}
height = 2
width = (height/8)*10
steps=5
size=5
stepheight = height/steps
hat = data.frame()
for(i in seq(0, height, by=stepheight)) {
l = -(width/(2*height))*(-height + i)
n = 50*l
y = 7.5 + runif(n, i, i+stepheight)
x = 5 + runif(n, -l, l)
color = runif(n)
tempdata = data.frame(x, y, color)
hat = rbind(hat, tempdata)
}
ggplot() + scale_x_continuous(limits = c(0,10)) +
scale_y_continuous(limits = c(0,10)) +
geom_circle(aes(x0=5, y0=2.5, r = 2.5), fill = "darkred", col = "darkred") +
geom_circle(aes(x0=5, y0=6.5, r = 1.5), fill = "antiquewhite1", col = "antiquewhite1") +
geom_rect(aes(xmin = 2.5, xmax = 7.5, ymin = 2.2, ymax = 2.5), fill = "black") +
geom_rect(aes(xmin = 4.8, xmax = 5.2, ymin = 2.2, ymax = 2.5), fill = "gold") +
geom_rect(aes(xmin = 4.9, xmax = 5.1, ymin = 2.3, ymax = 2.4), fill = "black") +
geom_point(data=data, aes(x=x, y=y, color=color), size=size) +
scale_colour_gradient(low="snow2", high="snow") +
geom_curve(aes(x = 4.5, xend = 5.5, y = 5, yend = 5), curvature = 0.5, size = 2, col = "black") +
geom_circle(aes(x0 = 4, y0 = 6.6, r = 0.2), fill = "pink", col = "pink") +
geom_circle(aes(x0 = 6, y0 = 6.6, r = 0.2), fill = "pink", col = "pink") +
geom_point(data=hat, aes(x=x, y=y), size=size, col = "darkred") +
geom_point(aes(x=4.5, y = 7), size= 5) +
geom_point(aes(x=5.5, y = 7), size= 5) +
geom_point(aes(x=5, y = 9.4), size= 9, col = "snow") +
geom_point(aes(x=5, y = 6.2), size= 8, col = "navajowhite1") +
geom_point(aes(x = x, y = y), data = data.frame(x = seq(3.8,6.2,0.01), y = runif(length(seq(3.8,6.2,0.01)), 7.4, 7.7)), col = "snow", size = 3) +
theme_bw()+
annotate("text", x = 5, y = 10, label = "Merry Christmas!",
family = "Luminari", size = 12) +
theme(legend.position = "none")
})
}
shinyApp(ui, server)
Kaylea Haynes
Data Scientist
I know quite a lot about time-series analysis, demand forecasting and changepoint detection but I’m currently trying to broaden my data science skills.